|
I am backing the Jays run line today. They are dropped a close one in extra innings last night, I like them to bounce back today.
5/30/2014 7:05 PM Reduced Baseball 916 Toronto Blue Jays* -1½ +155 vs Kansas City Royals J Vargas - L Listed J Happ - L Listed Risking 1.50 To Win 2.33 - Toronto lost a close one last night in extra innings, I like them to rebound strong today. In their last 10 games they have won 9, scoring 59 runs and covering the run line in 7 of the 10 games. The Jays are also 4-1 behind Happ in his last 5 starts, cashing the run line in all 4 of the wins. This is worth a run line bet on the team with the hot bats right now. We have 2 more MLB plays and 1 NBA play on today's VIP card. Click HERE for details on fully guaranteed VIP Packages. Lets Get It Rob We have had a nice run for free picks getting winners with both the Jays and Under in the Nationals game.
If you are not getting my picks by email, be sure to visit the home page and enter your name and email to get on my list. Today's free pick is 5/27/2014 7:05 PM MLB Baseball 964 Toronto Blue Jays* -½ +120 vs Tampa Bay Rays for 1st 5 Innings A Cobb - R Listed M Buehrle - L Listed Risking 1.50 To Win 1.80 – Buehrle is the best in the league for quality starts as a home favorite. Today he’s up against Alex Cobb who is no pushover, but I am confident the Jays have enough weapons to get the lead by the 5 inning mark. They hit Cobb well last time they faced off in Tampa, where they were up 4-0 after 5 and ended the game 4-2. Lets go with the hottest team in Baseball with their best pitcher at home. Lets Get IT Rob 5/17/2014 7:10 PM Reduced Baseball 975 Toronto Blue Jays* -1½ +150 vs Texas Rangers
Risking 1.00 To Win 1.50 – After a challenging Series against the Angels, the Toronto Blue Jays seem to have regained their stride. They got a signature win last night vs the Rangers Ace Yu Darvish, shutting out the Rangers 2-0. Today the Jays hand the ball to their Ace Mark Buehrle who has a league leading start at 7-1 with an ERA of 2.04. He is up against Robbie Ross who has struggled badly so far this season, going 1-4 with an ERA over 5. Ross has faced the Jays 6 times in his career and has yet to record a victory. Lets Get It Rob After a slow first few days of the month things have picked up nicely as we have continued to CRUSH bookies across North America in May. So far in March we are up another 13.88 units with VIP client picks. 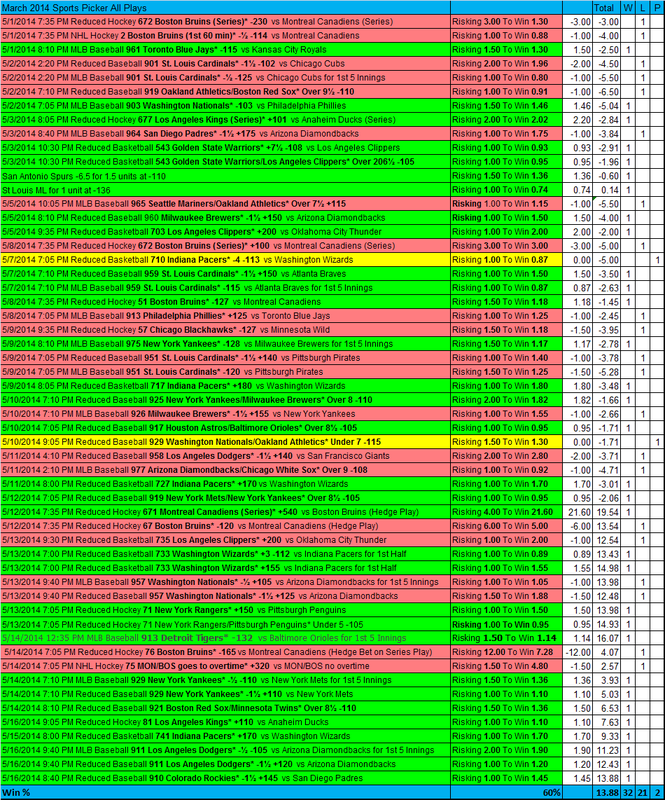 How do you rate a handicapper? The fact is most handicappers will send out updates only when they have a great run going... but how do you rank a handicapper over the long run? Before I get to that I want you to look at something. If you look at the results you will notice that we had one week that wasn't great... in fact Monday to Saturday it was brutal - check it out April 14-19th. I am not ashamed to admit it, we had a bad week... it happens. But the key is bankroll management. After we cashed our two series plays with Montreal Canadiens and Chicago Blackhawks we ended up only losing about 1.7 units on the week... not bad after the way that week started out. The key was bankroll management. So this brings me to my next point, how do you rate a handicapper? Who is better? Handicapper 1 who goes 8-2 (80%) over a week of picks Handicapper 2 who goes 60-40 (60%) on 100 plays Handicapper 3 who goes 550-450 (55%) on 1000 plays? Or the Handicapper who bets underdogs and wins 156.93 units on 129 units wagered across 89 plays? (Like I did in April 2014) If you are rating a handicapper who often bets underdogs like I do you have to pay attention to units won, units wagered, wager size and number of plays. I will explain further in section 2 below. Section 1 – Rating handicappers who bet against the spread – Examples 1-3 If you are ranking handicapper who bet against the spread you can use math – specifically the standard deviation and z-score. If you think about it when you are rating handicappers who pick against the spread you are trying to figure out how rare their results are. Spread bets can be compared to flipping a coin because the results are basically binary (not taking into account pushes) So what is more unexpected? Flipping a coin and landing on tails 8 out of 10 times or 60 out of 100 or 550 out of 1000? The first thing we need to figure out is the expected result, I will use 3 examples to illustrate this. For Handicapper 1 the expected result is 5 out of 10 For Handicapper 2 the expected result is 50 out of 100 For Handicapper 3 the expected result is 500 out of 1000 Next we need to determine the standard deviation how far off the expected result can be explained by random events. For Handicapper 1 we have 10 events Standard deviation is probability (in this case 50/50 or .5) * square root of # of plays (in this case 10 plays) Std = 0.5 * sqrt (10) = 0.5 * 3.16 = 1.58 Therefore we expect a variance of about 1.58 per 10 events For Handicapper 2 we can do the same calculation Std = 0.5 * sqrt (100) = 0.5 * 10 = 5 Therefore we expect a variance of about 5 per 100 events For Handicapper 3 we can do the same calculation Std = 0.5 * sqrt (1000) = 0.5 * 31.62 = 15.81 For handicapper 3 we expect a variance of 15.81 per 1000 events So that’s great now what? Well the next step is to determine the z-score. The z-score is a description of how unlikely an event is with handicappers. The formula for z-score is observed wins less expected wins divided by the standard deviation Z = [(observed wins) – (expected wins)] / std For Handicapper 1 Z = (8-5)/1.58 =1.90 For Handicapper 2 Z =(60-50)/5 =2 For Handicapper 3 Z =(550-500)/15.81 =50/15.81 =3.16 The key metrics to note are the normal distribution. 68% of all handicappers will achieve a z-score of 1 or less 95% of all handicappers will be below a z-score of 2. There for a z-score of 2 puts a handicapper in the to 5% of all handicappers A z-score of 3 is extremely unlikely. Puts a handicapper in the top 1% of all handicappers see the below image to review the normal distribution with z-score across the bottom. 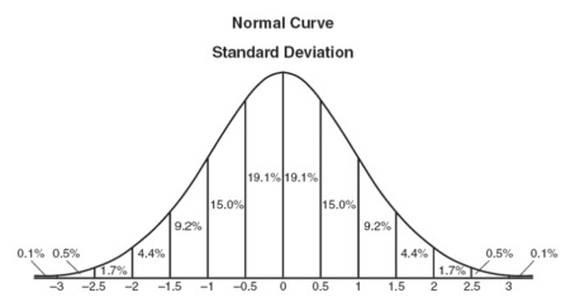
As a rule of thumb when selecting a handicapper to follow you should consider both the number of plays they provide in a sample and the number of units wagered and units won - see below for a further description of how to factor in different size unit plays.
Section 2 So how do you rank a handicapper who bets underdog and plus money plays and also varies unit bets? Well you need to first make sure you are comparing apples to apples. You must ensure that the units wagered are within a range – following progressive betting strategies are not considered because they are not real handicapping strategies. A reasonable range is 1-4 units or 1-5 units per play at most. I am going to use my results from April 2014 to demonstrate how to figure out the z-score for a handicapper who bets underdogs, plus money plays and varies unit strategy. The first think we should consider is the expected results – now that we are incorporating actual bets with the Juice we need to take that into account. At -105 lines the average bettor will lose money at approximately 5% per 100 units wagered. =100/105 =95.2 units returned (a loss of 5% due to the juice) Betting money lines the spread is often larger as the house lines get further apart. If you are betting a money line at +200 the opposite payout is likely -230 or more. We will use -110 for this example to be conservative as most of my money line bets don’t exceed a spread of -120. =100/110 =90.9 units To turn this into a probability we can take =1-[1/(expected return)+1] =1-(52.4%) =0.476 You average probability of winning works out to .476 (we will use this in place of the .5 in the mean and z-score calculation) We will use the number of bets placed to calculate the expected variance Std = 0.476 * sqrt (89) = 0.476 * 9.43 = 4.49 On 89 units wagered we would expect a standard deviation or variance of 4.49 BUT we also have to take into account the average bet size and the odds, before we compare this number to the results observed. If you look at my aggregate bets I risked a total of 129 units to win a potential of 168.68 units My average unit size per bet was: = 129/89 =1.449 This increases the Standard deviation to =4.49 * 1.449 =6.50 Average bet is =168.68/129 =1.308 Or American odds of about +131 This increases the Standard deviation to =6.5*1.31 =8.51 Recall from above Z = [(observed wins) – (expected wins)] / std In this case Z = [(observed return) – (expected return)] / std Since I bet 129 units we can calculate the expected return of =129/110 =117.27 My observed return was the actual amount that we won which was 156.93 units =156.93 Z = (156.93-117.27)/8.51 = 39.66/8.51 = 4.66 *Things to note – My April results had the Masters tournament included where we won 7 units on 10 wagered. If we remove the Masters tournament the results actually increase to a z-score of 5.45 These calculations are compared to the average population. You may want to factor in a winning % of 5% to compare these results against top handicappers. The average winning handicapper wins just a small % above 52.4% of their bets to cover the juice. A very good handicapper can return about 5% on their money wagered. If you increase the expected wins to 5% that would chance the z-score as follows Expected wins = 129*1.05 =135.45 Z =(156.93-135.45)/8/51 =21.48/8.51 =2.52 The Z-Score drops considerably but still rates in the top 0.5% of the population of winning professional handicappers. This money we returned 21.7% on our money wagered these results are in the top 10th of the top 10th of 1% of the population. If you stick to a basic unit strategy and follow the wagers as posted you will become rich very very quickly with results like this… note these results 100% real and were sent to clients – however past results do not necessarily reflect future performance. To conclude Most handicappers are scared of this number because it highlights how average or actually bad they really are. Winning handicappers are rare, and most handicappers make it virtually impossible to calculate this as they don’t provide complete results or only show win%. Other factors to consider: Slippage – you can expect a slippage of approximately 5-10% when following a good handicappers bets. This is impossible to avoid. This is due to the sports books rebalancing their lines. If a good handicapper notices a line, approximately 5-10% of the time the line will have moved by the time you receive the email or text message. This can be frustrating but is generally the sign of a good handicapper. If a handicapper is consistently sending out stale lines you should be careful. Shading lines is the oldest trick in the book for scamdicappers. One way to check this is to look at the time you receive the email and compare the line posted to the lines by time on a service like sports insights. Sports Insights shows you the times when the lines in Vegas move. This is generally a pretty reliable measuring stick. Posting a Free pick today and tomorrow so be sure to check back.
5/8/2014 7:35 PM Reduced Hockey 51 Boston Bruins* -127 vs Montreal Canadiens Risking 1.50 To Win 1.18– Many of you probably already knew this pick was coming… I am not going to rehash all the reasons I like Boston here as I have already sent that out in the series emails. Bottom line is they are the better team and they play their best when they are under pressure. I like them to even things up tonight. Lets Get It Rob I am a bit late posting the last few weeks plays due to my crazy travel schedule lately. I am proud to announce that April was another outstanding month for Sports Picker VIP clients. We banked 27.93 units cashing tons of underdog and plus money plays. Check out the full list of all 89 plays below. 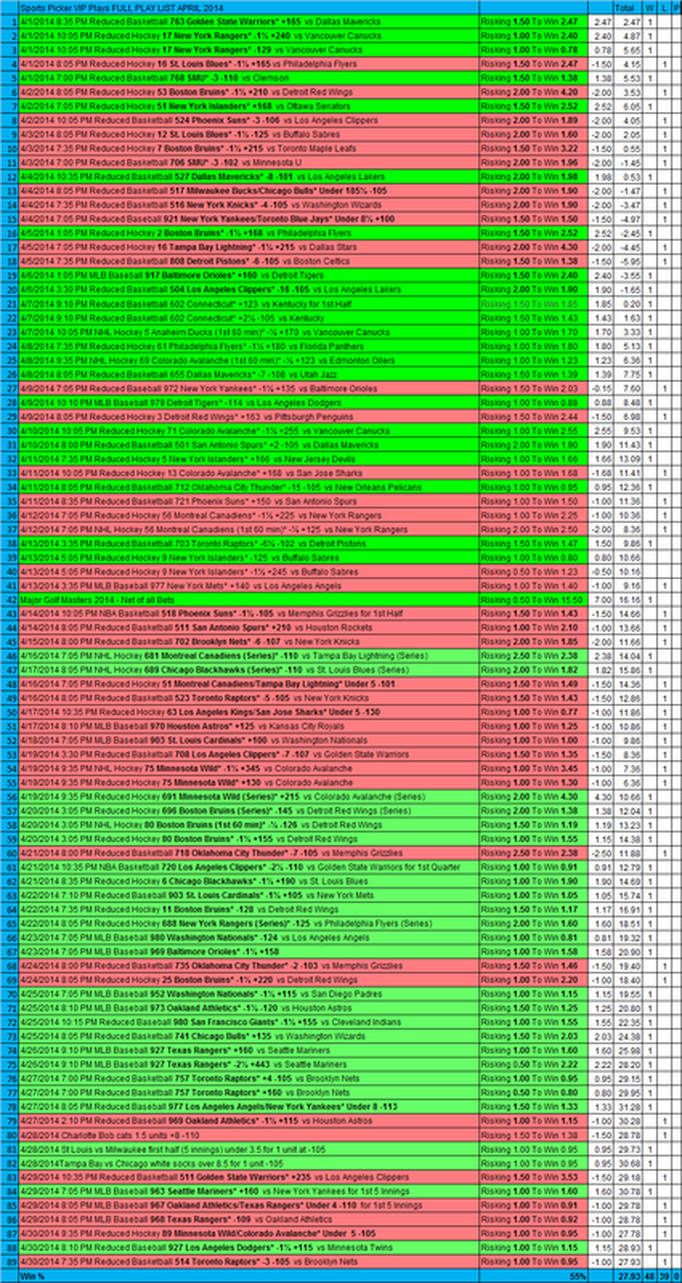
Rob Holiday goes 5-0 in NHL Series plays for a massive round 1 win of 11.48 units!
There is still time to register as a VIP client for only $99 per month and get all of the round 9 Series plays. Remember I guarantee my picks will win over a 30 day period or you get your money back, or a free extension. Click HERE for details. Check out all the plays and Write ups sent to VIP members below. NHL Sent April 16th 4/16/2014 7:05 PM NHL Hockey 681 Montreal Canadiens (Series)* -110 vs Tampa Bay Lightning (Series) Risking 2.50 To Win 2.38 - WINNER These two teams enter the playoffs with almost identical records. The difference in my opinion is that I think the Canadians have become a better team as he season wore on, where as Tampa, after losing their star goal scorer Martin St Louis, I don't feel is quite what they were back at the beginning of the season. The other big advantage I give to the Canadiens is goal tending. Carey Price has looked dangerous lately, and if he continues his recent form, he can be the type of goalie to steal you a game AND a series. Make a 2.5 unit play on Montreal. NHL Sent April 16th 4/17/2014 8:05 PM NHL Hockey 689 Chicago Blackhawks (Series)* -110 vs St. Louis Blues (Series) Risking 2.00 To Win 1.82 WINNER Neither one of these teams have looked good heading into the playoffs. Both teams in my opinion are worthy of making a deep run into the playoffs however one will go home in no more than 7 games. My bet is based on the Blackhawks getting their two star players back in Kane and Toews. The Blues also have some key player that could return from the injury list just in time for the playoffs, however the biggest question remains around Ryan Miller, one of the best goal tenders of this era, he has faltered over the last month, going 1-5 in the month of April with a paltry .885 save %. Something that will need to be improved to keep up with a healthy Blackhawks team. To compound the problem the Blues haven't been able to put the puck in the net at the other end lately either, scoring just 8 goals in their last 8 games. I am going with the Defending Stanley cup champions to get it done here NHL Sent April 19th 4/19/2014 9:35 PM Reduced Hockey 691 Minnesota Wild (Series)* +215 vs Colorado Avalanche (Series) Risking 2.00 To Win 4.30 - WINNER I came close to taking the Wild in this series in the 1st place. At +215 it's a great value play especially considering how close they came to winning game 1. The Wild are one of the best teams in the NHL at home. If they can steal just one on the road I think they have a fantastic shot of taking this series. Even if they don't get it done on the road tonight they have 2 home games coming up where I expect them to play very well. NHL Sent April 20th 4/20/2014 3:05 PM Reduced Hockey 696 Boston Bruins (Series)* -145 vs Detroit Red Wings (Series) Risking 2.00 To Win 1.38 - WINNER I am glad we avoided the play on Boston in game 1 as you never know how a team is going to come back into rhythm after sitting key player at the end of the regular season. Detroit winning game 1 has given us an opportunity to jump into this series and get Boston at not great, but acceptable odds. Make a 2 unit play on the best team in the NHL to get it done en route to another deep playoff run. NHL SERIES PLAY – Sent April 22nd 4/22/2014 8:05 PM Reduced Hockey 688 New York Rangers (Series)* -125 vs Philadelphia Flyers (Series) - Note this is a SERIES bet. Risking 2.00 To Win 1.60 - WINNER I liked New York to win this series from the start but I couldn't justify paying -145 for them before the series started. At -125 we can make this play. Philly earned home ice advantage by winning one in New York last weekend. This however, in my analysis it doesn't really make much of a difference. New York is a better road team than they are home team anyways. Statistically the teams are very close in the win loss column. The difference comes when you drill down to individual team stats and look at how the teams have performed recently. Looking at the Power Play and PK. Philly is one of the most penalized teams in the league allowing 3.9 power plays against per game. New York allows the 2nd fewest at 2.8 per game. Philly also allows more shorthanded goals at 11 for the year and allowed 43 power play goals. Looking at this and factoring in what happened in game 1. This is likely to be the deciding factor for this series. New York is a FAR superior team when either shorthanded or on the Power Play. Looking at goals for and Against I mentioned this in one of my emails from last week, New York holds a big advantage when you look at goals allowed in crunch time. They play far better defensive hockey and can button down when needed. They dominate the 3rd period play compared to Philly. For the regular season looking at 3rd period goals allowed New York allowed 56 3rd period goals while Philly allowed 85. Huge difference. New York has the ability to close games out while Philly struggles. This may also come into play in overtime as the same theory applies. |
Help keep the FREE Picks coming. Sign up for an account at one of my recommended sports books.

Authors
|

 RSS Feed

|
|
Fantasy Sports Sites
Fanduel |
**Important** The information on this site is for entertainment purposes only. I am not liable for any losses that incurred as a result of the information on this website. Any use of this information in violation of any state, federal, or local laws is prohibited. This site assumes no responsibility for the actions by and makes no representation or endorsement of any of these games and/or activities if they are illegal in the jurisdiction of the reader or client of this site.
Copyright © Sports-Picker.com 2012-2015 All Rights Reserved.
Copyright © Sports-Picker.com 2012-2015 All Rights Reserved.